


Notebooks

Categories


Cells
Premium

BioTuring
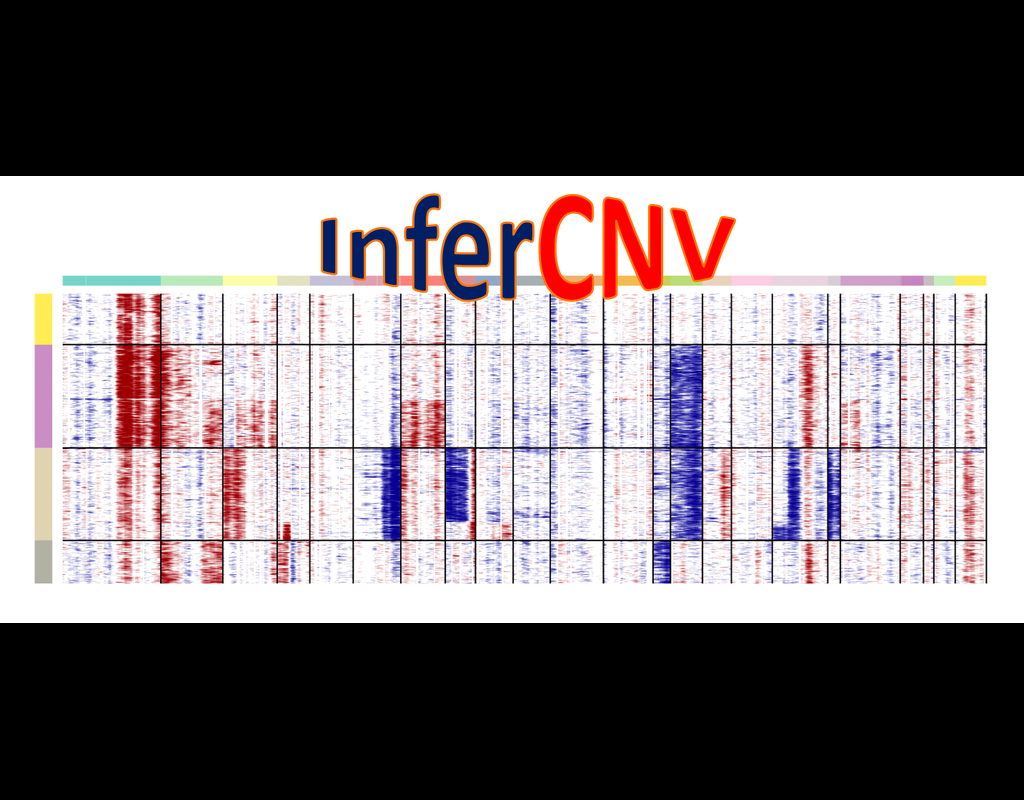
InferCNV is used to explore tumor single cell RNA-Seq data to identify evidence for somatic large-scale chromosomal copy number alterations, such as gains or deletions of entire chromosomes or large segments of chromosomes. This is done by exploring expression intensity of genes across positions of tumor genome in comparison to a set of reference 'normal' cells. A heatmap is generated illustrating the relative expression intensities across each chromosome, and it often becomes readily apparent as to which regions of the tumor genome are over-abundant or less-abundant as compared to that of normal cells.
**Infercnvpy** is a scalable python library to infer copy number variation (CNV) events from single cell transcriptomics data. It is heavliy inspired by InferCNV, but plays nicely with scanpy and is much more scalable.

BioTuring
Expanded CRISPR-compatible CITE-seq (ECCITE-seq) which is built upon pooled CRISPR screens, allows to simultaneously measure transcriptomes, surface protein levels, and single-guide RNA (sgRNA) sequences at single-cell resolution. The technique enables multimodal characterization of each perturbation and effect exploration. However, it also encounters heterogeneity and complexity which can cause substantial noise into downstream analyses.
Mixscape (Papalexi, Efthymia, et al., 2021) is a computational framework proposed to substantially improve the signal-to-noise ratio in single-cell perturbation screens by identifying and removing confounding sources of variation.
In this notebooks, we demonstrate Mixscape's features using pertpy - a Python package offering a range of tools for perturbation analysis. The original pipeline of Mixscape implemented in R can be found here.

BioTuring
Single-cell RNA sequencing (scRNA-seq) protocols often face challenges in measuring the expression of all genes within a cell due to various factors, such as technical noise, the sensitivity of scRNA-seq techniques, or sample quality. This limitation gives rise to a need for the prediction of unmeasured gene expression values (also known as dropout imputation) from scRNA-seq data.
ADImpute (Leote A, 2023) is an R package combining several dropout imputation methods, including two existing methods (DrImpute, SAVER), two novel implementations: Network, a gene regulatory network-based approach using gene-gene relationships learned from external data, and Baseline, a method corresponding to a sample-wide average..
This notebook is to illustrate an example workflow of ADImpute on sample datasets loaded from the package. The notebook content is inspired from ADImpute's vignette and modified to demonstrate how the tool works on BioTuring's platform.

BioTuring
Single-cell RNA data allows cell-cell communications (***CCC***) methods to infer CCC at either the individual cell or cell cluster/cell type level, but physical distances between cells are not preserved Almet, Axel A., et al., (2021). On the other hand, spatial data provides spatial distances between cells, but single-cell or gene resolution is potentially lost. Therefore, integrating two types of data in a proper manner can complement their strengths and limitations, from that improve CCC analysis.
In this pipeline, we analyze CCC on Visium data with single-cell data as a reference. The pipeline includes 4 sub-notebooks as following
01-deconvolution: This step involves deconvolution and cell type annotation for Visium data, with cell type information obtained from a relevant single-cell dataset. The deconvolution method is SpatialDWLS which is integrated in Giotto package.
02-giotto: performs spatial based CCC and expression based CCC on Visium data using Giotto method.
03-nichenet: performs spatial based CCC and expression based CCC on Visium data using NicheNet method.
04-visualization: visualizes CCC results obtained from Giotto and NicheNet.
Trends

BioTuring
Spatially resolved gene expression profiles are key to understand tissue organization and function. However, spatial transcriptomics (ST) profiling techniques lack single-cell resolution and require a combination with single-cell RNA sequencing (scRN(More)