


Notebooks

Categories


Cells
Premium


BioTuring
Computational methods that model how the gene expression of a cell is influenced by interacting cells are lacking.
We present NicheNet, a method that predicts ligand–target links between interacting cells by combining their expression data with prior knowledge of signaling and gene regulatory networks.
We applied NicheNet to the tumor and immune cell microenvironment data and demonstrated that NicheNet can infer active ligands and their gene regulatory effects on interacting cells.
BioTuring
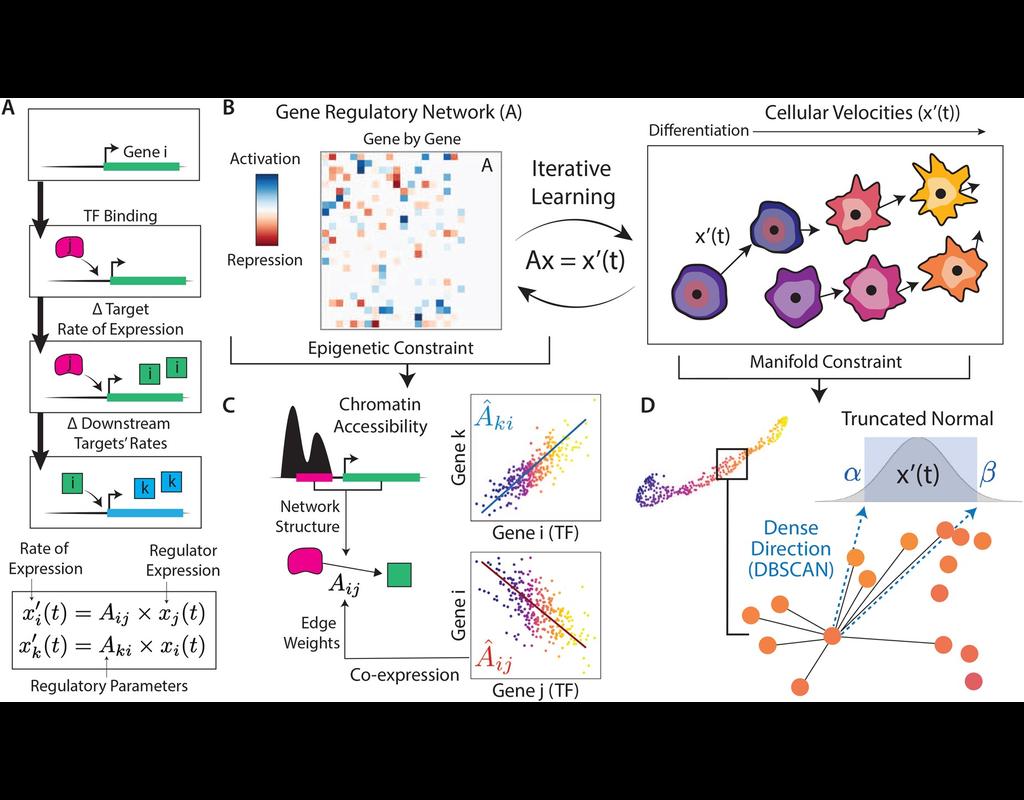
In the realm of transcriptional dynamics, understanding the intricate interplay of regulatory proteins is crucial for deciphering processes ranging from normal development to disease progression. However, traditional RNA velocity methods often overlook the underlying regulatory drivers of gene expression changes over time. This gap in knowledge hinders our ability to unravel the mechanistic intricacies of these dynamic processes.
scKINETICs (Key regulatory Interaction NETwork for Inferring Cell Speed) (Burdziak et al, 2023) offers a dynamic model for gene expression changes that simultaneously learns per-cell transcriptional velocities and a governing gene regulatory network. By employing an expectation-maximization approach, scKINETICS quantifies the impact of each regulatory element on its target genes, incorporating insights from epigenetic data, gene-gene coexpression patterns and constraints dictated by the phenotypic manifold.

BioTuring
Single-cell RNA sequencing methods can profile the transcriptomes of single cells but cannot preserve spatial information. Conversely, spatial transcriptomics assays can profile spatial regions in tissue sections but do not have single-cell resolution.
Here, Runmin Wei (Siyuan He, Shanshan Bai, Emi Sei, Min Hu, Alastair Thompson, Ken Chen, Savitri Krishnamurthy & Nicholas E. Navin) developed a computational method called CellTrek that combines these two datasets to achieve single-cell spatial mapping through coembedding and metric learning approaches. They benchmarked CellTrek using simulation and in situ hybridization datasets, which demonstrated its accuracy and robustness.
They then applied CellTrek to existing mouse brain and kidney datasets and showed that CellTrek can detect topological patterns of different cell types and cell states. They performed single-cell RNA sequencing and spatial transcriptomics experiments on two ductal carcinoma in situ tissues and applied CellTrek to identify tumor subclones that were restricted to different ducts, and specific T-cell states adjacent to the tumor areas.

BioTuring
Single-cell RNA sequencing (scRNA-seq) protocols often face challenges in measuring the expression of all genes within a cell due to various factors, such as technical noise, the sensitivity of scRNA-seq techniques, or sample quality. This limitation gives rise to a need for the prediction of unmeasured gene expression values (also known as dropout imputation) from scRNA-seq data.
ADImpute (Leote A, 2023) is an R package combining several dropout imputation methods, including two existing methods (DrImpute, SAVER), two novel implementations: Network, a gene regulatory network-based approach using gene-gene relationships learned from external data, and Baseline, a method corresponding to a sample-wide average..
This notebook is to illustrate an example workflow of ADImpute on sample datasets loaded from the package. The notebook content is inspired from ADImpute's vignette and modified to demonstrate how the tool works on BioTuring's platform.
Trends
BioTuring
Single-cell RNA sequencing methods can profile the transcriptomes of single cells but cannot preserve spatial information. Conversely, spatial transcriptomics assays can profile spatial regions in tissue sections but do not have single-cell resolutio(More)