


Notebooks

Categories


Cells
Premium


BioTuring
Power analyses are considered important factors in designing high-quality experiments. However, such analyses remain a challenge in single-cell RNA-seq studies due to the presence of hierarchical structure within the data (Zimmerman et al., 2021). As cells sampled from the same individual share genetic and environmental backgrounds, these cells are more correlated than cells sampled from different individuals. Currently, most power analyses and hypothesis tests (e.g., differential expression) in scRNA-seq data treat cells as if they were independent, thus ignoring the intra-sample correlation, which could lead to incorrect inferences.
Hierarchicell (Zimmerman, K.D. and Langefeld, C.D., 2021) is an R package proposed to estimate power for testing hypotheses of differential expression in scRNA-seq data while considering the hierarchical correlation structure that exists in the data. The method offers four important categories of functions: data loading and cleaning, empirical estimation of distributions, simulating expression data, and computing type 1 error or power.
In this notebook, we will illustrate an example workflow of Hierarchicell. The notebook is inspired by Hierarchicell's vignette and modified to demonstrate how the tool works on BioTuring's platform.

BioTuring
Single-cell RNA data allows cell-cell communications (***CCC***) methods to infer CCC at either the individual cell or cell cluster/cell type level, but physical distances between cells are not preserved Almet, Axel A., et al., (2021). On the other hand, spatial data provides spatial distances between cells, but single-cell or gene resolution is potentially lost. Therefore, integrating two types of data in a proper manner can complement their strengths and limitations, from that improve CCC analysis.
In this pipeline, we analyze CCC on Visium data with single-cell data as a reference. The pipeline includes 4 sub-notebooks as following
01-deconvolution: This step involves deconvolution and cell type annotation for Visium data, with cell type information obtained from a relevant single-cell dataset. The deconvolution method is SpatialDWLS which is integrated in Giotto package.
02-giotto: performs spatial based CCC and expression based CCC on Visium data using Giotto method.
03-nichenet: performs spatial based CCC and expression based CCC on Visium data using NicheNet method.
04-visualization: visualizes CCC results obtained from Giotto and NicheNet.

BioTuring
Spatially resolved gene expression profiles are key to understand tissue organization and function. However, spatial transcriptomics (ST) profiling techniques lack single-cell resolution and require a combination with single-cell RNA sequencing (scRNA-seq) information to deconvolute the spatially indexed datasets.
Leveraging the strengths of both data types, we developed SPOTlight, a computational tool that enables the integration of ST with scRNA-seq data to infer the location of cell types and states within a complex tissue. SPOTlight is centered around a seeded non-negative matrix factorization (NMF) regression, initialized using cell-type marker genes and non-negative least squares (NNLS) to subsequently deconvolute ST capture locations (spots).
Simulating varying reference quantities and qualities, we confirmed high prediction accuracy also with shallowly sequenced or small-sized scRNA-seq reference datasets. SPOTlight deconvolution of the mouse brain correctly mapped subtle neuronal cell states of the cortical layers and the defined architecture of the hippocampus. In human pancreatic cancer, we successfully segmented patient sections and further fine-mapped normal and neoplastic cell states.
Trained on an external single-cell pancreatic tumor references, we further charted the localization of clinical-relevant and tumor-specific immune cell states, an illustrative example of its flexible application spectrum and future potential in digital pathology.
BioTuring
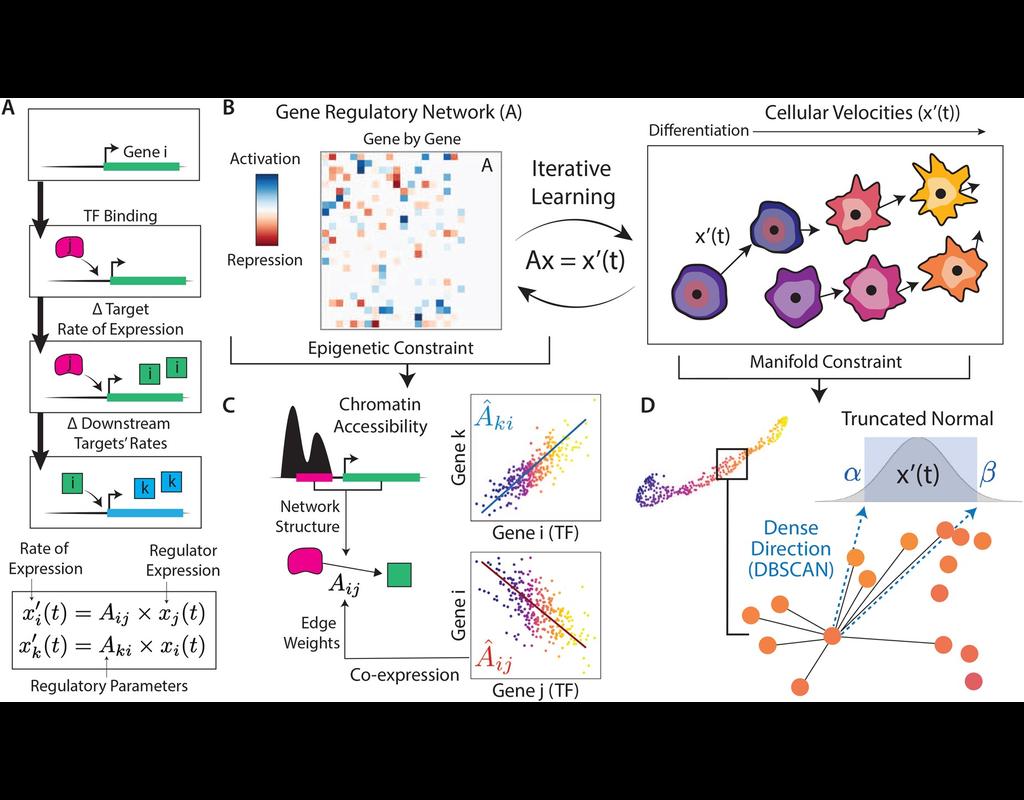
In the realm of transcriptional dynamics, understanding the intricate interplay of regulatory proteins is crucial for deciphering processes ranging from normal development to disease progression. However, traditional RNA velocity methods often overlook the underlying regulatory drivers of gene expression changes over time. This gap in knowledge hinders our ability to unravel the mechanistic intricacies of these dynamic processes.
scKINETICs (Key regulatory Interaction NETwork for Inferring Cell Speed) (Burdziak et al, 2023) offers a dynamic model for gene expression changes that simultaneously learns per-cell transcriptional velocities and a governing gene regulatory network. By employing an expectation-maximization approach, scKINETICS quantifies the impact of each regulatory element on its target genes, incorporating insights from epigenetic data, gene-gene coexpression patterns and constraints dictated by the phenotypic manifold.
Trends
BioTuring
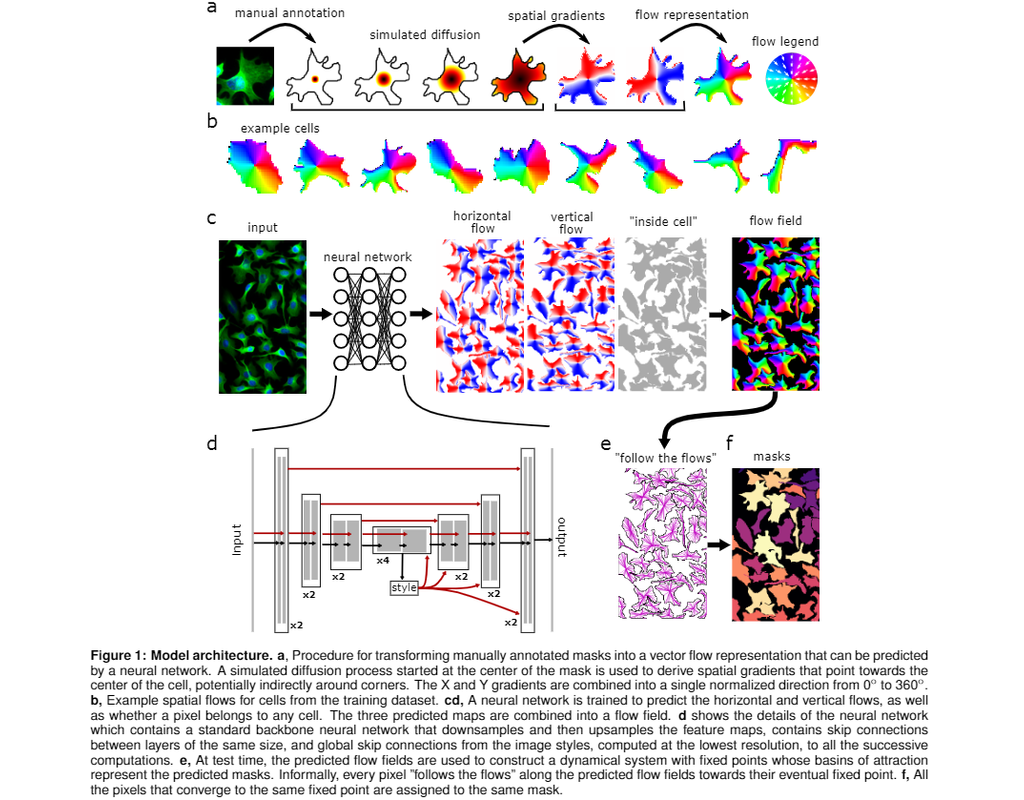
Cell segmentation is the process of identifying and isolating individual cells in an image, typically a microscopic image. This is a crucial step in many biological studies, as it allows researchers to analyze individual cells and their properties.
(More)