


Notebooks

Categories


Cells
Premium


BioTuring
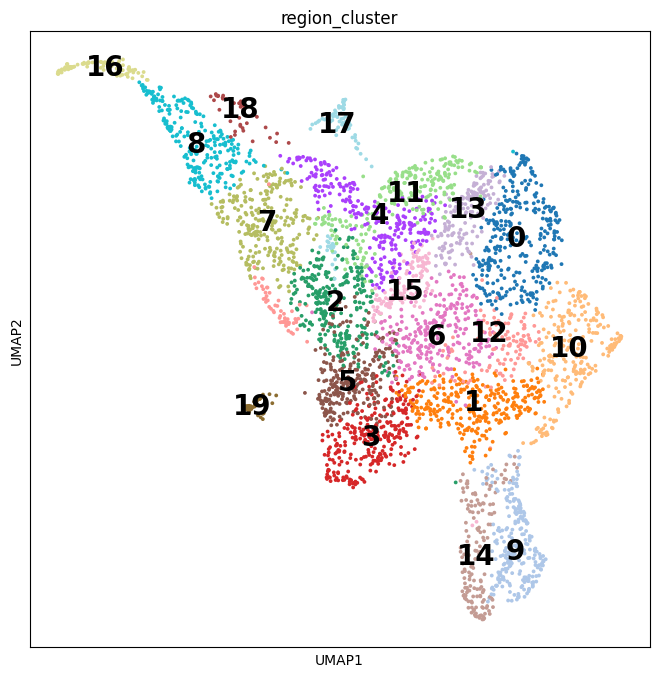
Mapping out the coarse-grained connectivity structures of complex manifolds
Biological systems often change over time, as old cells die and new cells are created through differentiation from progenitor cells. This means that at any given time, not all cells will be at the same stage of development. In this sense, a single-cell sample could contain cells at different stages of differentiation. By analyzing the data, we can identify which cells are at which stages and build a model for their biological transitions.
By quantifying the connectivity of partitions (groups, clusters) of the single-cell graph, partition-based graph abstraction (PAGA) generates a much simpler abstracted graph (PAGA graph) of partitions, in which edge weights represent confidence in the presence of connections.
In this notebook, we will introduce the concept of single-cell Trajectory Analysis using PAGA (Partition-based graph abstraction) in the context of hematopoietic differentiation.
BioTuring
Cell2location is a principled Bayesian model that can resolve fine-grained cell types in spatial transcriptomic data and create comprehensive cellular maps of diverse tissues. Cell2location accounts for technical sources of variation and borrows statistical strength across locations, thereby enabling the integration of single cell and spatial transcriptomics with higher sensitivity and resolution than existing tools. This is achieved by estimating which combination of cell types in which cell abundance could have given the mRNA counts in the spatial data, while modelling technical effects (platform/technology effect, contaminating RNA, unexplained variance).
This tutorial shows how to use cell2location method for spatially resolving fine-grained cell types by integrating 10X Visium data with scRNA-seq reference of cell types. Cell2location is a principled Bayesian model that estimates which combination of cell types in which cell abundance could have given the mRNA counts in the spatial data, while modelling technical effects (platform/technology effect, contaminating RNA, unexplained variance).

BioTuring
Power analyses are considered important factors in designing high-quality experiments. However, such analyses remain a challenge in single-cell RNA-seq studies due to the presence of hierarchical structure within the data (Zimmerman et al., 2021). As cells sampled from the same individual share genetic and environmental backgrounds, these cells are more correlated than cells sampled from different individuals. Currently, most power analyses and hypothesis tests (e.g., differential expression) in scRNA-seq data treat cells as if they were independent, thus ignoring the intra-sample correlation, which could lead to incorrect inferences.
Hierarchicell (Zimmerman, K.D. and Langefeld, C.D., 2021) is an R package proposed to estimate power for testing hypotheses of differential expression in scRNA-seq data while considering the hierarchical correlation structure that exists in the data. The method offers four important categories of functions: data loading and cleaning, empirical estimation of distributions, simulating expression data, and computing type 1 error or power.
In this notebook, we will illustrate an example workflow of Hierarchicell. The notebook is inspired by Hierarchicell's vignette and modified to demonstrate how the tool works on BioTuring's platform.

BioTuring
Single-cell RNA sequencing (scRNA-seq) data have allowed us to investigate cellular heterogeneity and the kinetics of a biological process. Some studies need to understand how cells change state, and corresponding genes during the process, but it is challenging to track the cell development in scRNA-seq protocols. Therefore, a variety of statistical and computational methods have been proposed for lineage inference (or pseudotemporal ordering) to reconstruct the states of cells according to the developmental process from the measured snapshot data. Specifically, lineage refers to an ordered transition of cellular states, where individual cells represent points along. pseudotime is a one-dimensional variable representing each cell’s transcriptional progression toward the terminal state.
Slingshot which is one of the methods suggested for lineage reconstruction and pseudotime inference from single-cell gene expression data. In this notebook, we will illustrate an example workflow for cell lineage and pseudotime inference using Slingshot. The notebook is inspired by Slingshot's vignette and modified to demonstrate how the tool works on BioTuring's platform.
Trends
BioTuring
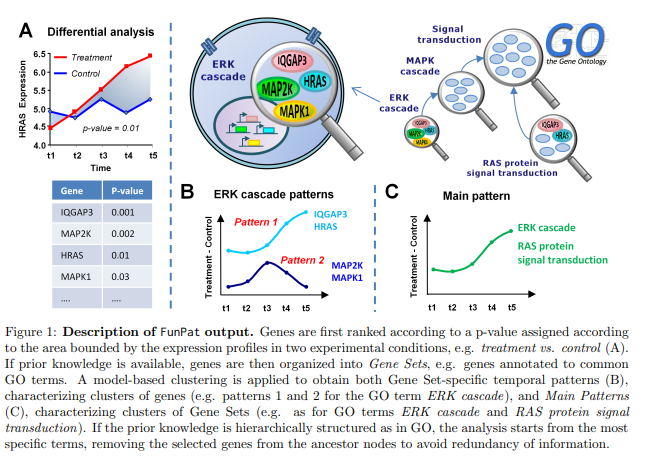
Dynamic expression data, nowadays obtained using high-throughput RNA sequencing (RNA-seq), are essential to monitor transient gene expression changes and to study the dynamics of their transcriptional activity in the cell or response to stimuli. FunP(More)