


Notebooks

Categories


Cells
Premium


BioTuring
The recent development of experimental methods for measuring chromatin state at single-cell resolution has created a need for computational tools capable of analyzing these datasets. Here we developed Signac, a framework for the analysis of single-cell chromatin data, as an extension of the Seurat R toolkit for single-cell multimodal analysis.
**Signac** enables an end-to-end analysis of single-cell chromatin data, including peak calling, quantification, quality control, dimension reduction, clustering, integration with single-cell gene expression datasets, DNA motif analysis, and interactive visualization.
Furthermore, Signac facilitates the analysis of multimodal single-cell chromatin data, including datasets that co-assay DNA accessibility with gene expression, protein abundance, and mitochondrial genotype. We demonstrate scaling of the Signac framework to datasets containing over 700,000 cells.
BioTuring
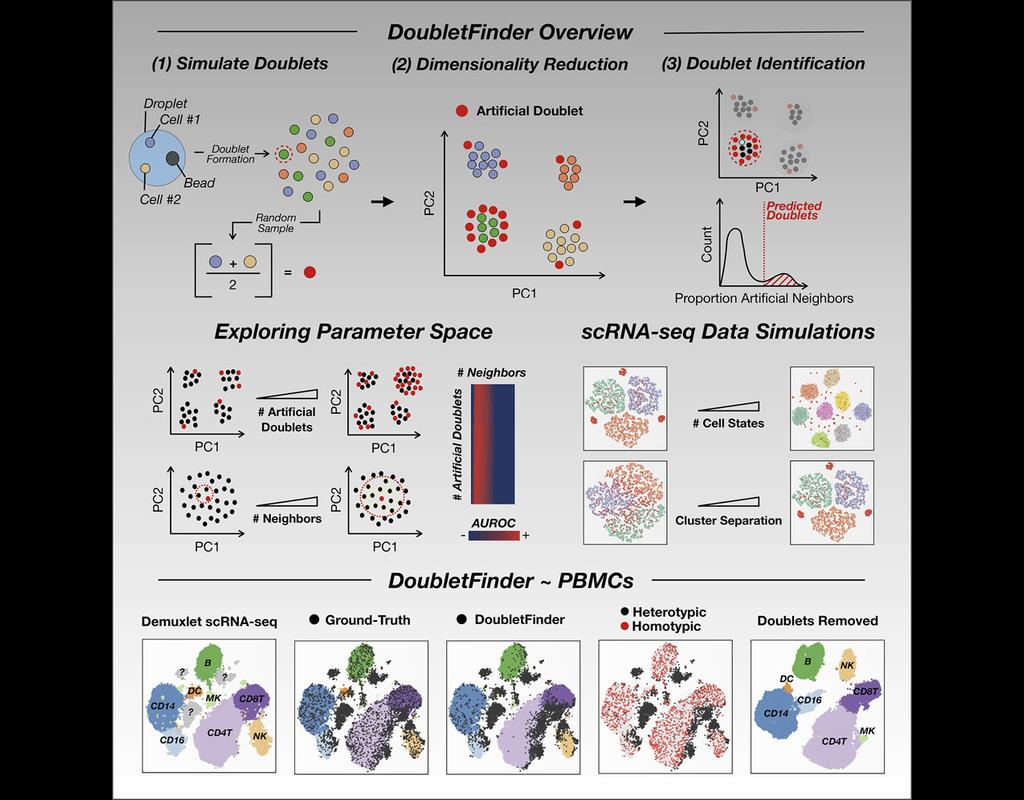
Single-cell RNA sequencing (scRNA-seq) data often encountered technical artifacts called "doublets" which are two cells that are sequenced under the same cellular barcode.
Doublets formed from different cell types or states are called heterotypic and homotypic otherwise. These factors constrain cell throughput and may result in misleading biological interpretations.
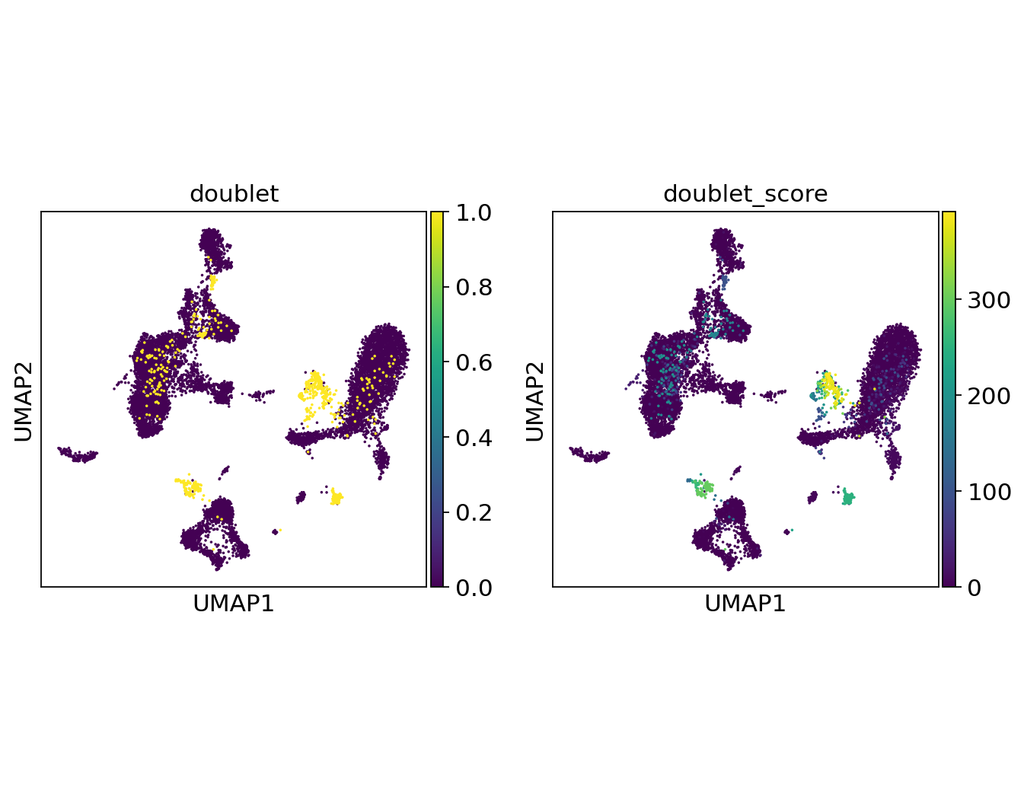
DoubletFinder (McGinnis, Murrow, and Gartner 2019) is one of the methods proposed for doublet detection. In this notebook, we will illustrate an example workflow of DoubletFinder. We use a 10x Genomics dataset which captures peripheral blood mononuclear cells (PBMCs) from a healthy donor stained with a panel of 31 TotalSeq™-B antibodies (BioLegend).

BioTuring
Expanded CRISPR-compatible CITE-seq (ECCITE-seq) which is built upon pooled CRISPR screens, allows to simultaneously measure transcriptomes, surface protein levels, and single-guide RNA (sgRNA) sequences at single-cell resolution. The technique enables multimodal characterization of each perturbation and effect exploration. However, it also encounters heterogeneity and complexity which can cause substantial noise into downstream analyses.
Mixscape (Papalexi, Efthymia, et al., 2021) is a computational framework proposed to substantially improve the signal-to-noise ratio in single-cell perturbation screens by identifying and removing confounding sources of variation.
In this notebooks, we demonstrate Mixscape's features using pertpy - a Python package offering a range of tools for perturbation analysis. The original pipeline of Mixscape implemented in R can be found here.
BioTuring
Doublets are a characteristic error source in droplet-based single-cell sequencing data where two cells are encapsulated in the same oil emulsion and are tagged with the same cell barcode. Across type doublets manifest as fictitious phenotypes that can be incorrectly interpreted as novel cell types. DoubletDetection present a novel, fast, unsupervised classifier to detect across-type doublets in single-cell RNA-sequencing data that operates on a count matrix and imposes no experimental constraints.
This classifier leverages the creation of in silico synthetic doublets to determine which cells in the
input count matrix have gene expression that is best explained by the combination of distinct cell
types in the matrix.
In this notebook, we will illustrate an example workflow for detecting doublets in single-cell RNA-seq count matrices.
Trends

BioTuring
Power analyses are considered important factors in designing high-quality experiments. However, such analyses remain a challenge in single-cell RNA-seq studies due to the presence of hierarchical structure within the data (Zimmerman et al., 2021). As(More)