


Notebooks

Categories


Cells
Premium


BioTuring
Many spatially resolved transcriptomic technologies do not have single-cell resolution but measure the average gene expression for each spot from a mixture of cells of potentially heterogeneous cell types.
Here, we introduce a deconvolution method, conditional autoregressive-based deconvolution (CARD), that combines cell-type-specific expression information from single-cell RNA sequencing (scRNA-seq) with correlation in cell-type composition across tissue locations. Modeling spatial correlation allows us to borrow the cell-type composition information across locations, improving accuracy of deconvolution even with a mismatched scRNA-seq reference.
**CARD** can also impute cell-type compositions and gene expression levels at unmeasured tissue locations to enable the construction of a refined spatial tissue map with a resolution arbitrarily higher than that measured in the original study and can perform deconvolution without an scRNA-seq reference.
Applications to four datasets, including a pancreatic cancer dataset, identified multiple cell types and molecular markers with distinct spatial localization that define the progression, heterogeneity and compartmentalization of pancreatic cancer.

BioTuring
Build single-cell trajectories with the software that introduced **pseudotime**. Find out about cell fate decisions and the genes regulated as they're made.
Group and classify your cells based on gene expression. Identify new cell types and states and the genes that distinguish them.
Find genes that vary between cell types and states, over trajectories, or in response to perturbations using statistically robust, flexible differential analysis.
In development, disease, and throughout life, cells transition from one state to another. Monocle introduced the concept of **pseudotime**, which is a measure of how far a cell has moved through biological progress.
Many researchers are using single-cell RNA-Seq to discover new cell types. Monocle 3 can help you purify them or characterize them further by identifying key marker genes that you can use in follow-up experiments such as immunofluorescence or flow sorting.
**Single-cell trajectory analysis** shows how cells choose between one of several possible end states. The new reconstruction algorithms introduced in Monocle 3 can robustly reveal branching trajectories, along with the genes that cells use to navigate these decisions.

BioTuring
The development of immune checkpoint-based immunotherapies has been a major advancement in the treatment of cancer, with a subset of patients exhibiting durable clinical responses. A predictive biomarker for immunotherapy response is the pre-existing T-cell infiltration in the tumor immune microenvironment (TIME).
Bulk transcriptomics-based approaches can quantify the degree of T-cell infiltration using deconvolution methods and identify additional markers of inflamed/cold cancers at the bulk level. However, bulk techniques are unable to identify biomarkers of individual cell types. Although single-cell RNA sequencing (scRNAseq) assays are now being used to profile the TIME, to our knowledge there is no method of identifying patients with a T-cell inflamed TIME from scRNAseq data. Here, we describe a method, iBRIDGE, which integrates reference bulk RNAseq data with the malignant subset of scRNAseq datasets to identify patients with a T-cell inflamed TIME.
Utilizing two datasets with matched bulk data, we show iBRIDGE results correlated highly with bulk assessments (0.85 and 0.9 correlation coefficients). Using iBRIDGE, we identified markers of inflamed phenotypes in malignant cells, myeloid cells, and fibroblasts, establishing type I and type II interferon pathways as dominant signals, especially in malignant and myeloid cells, and finding the TGFβ-driven mesenchymal phenotype not only in fibroblasts but also in malignant cells.
Besides relative classification, per-patient average iBRIDGE scores and independent RNAScope quantifications were utilized for threshold-based absolute classification. Moreover, iBRIDGE can be applied to in vitro grown cancer cell lines and can identify the cell lines that are adapted from inflamed/cold patient tumors.
BioTuring
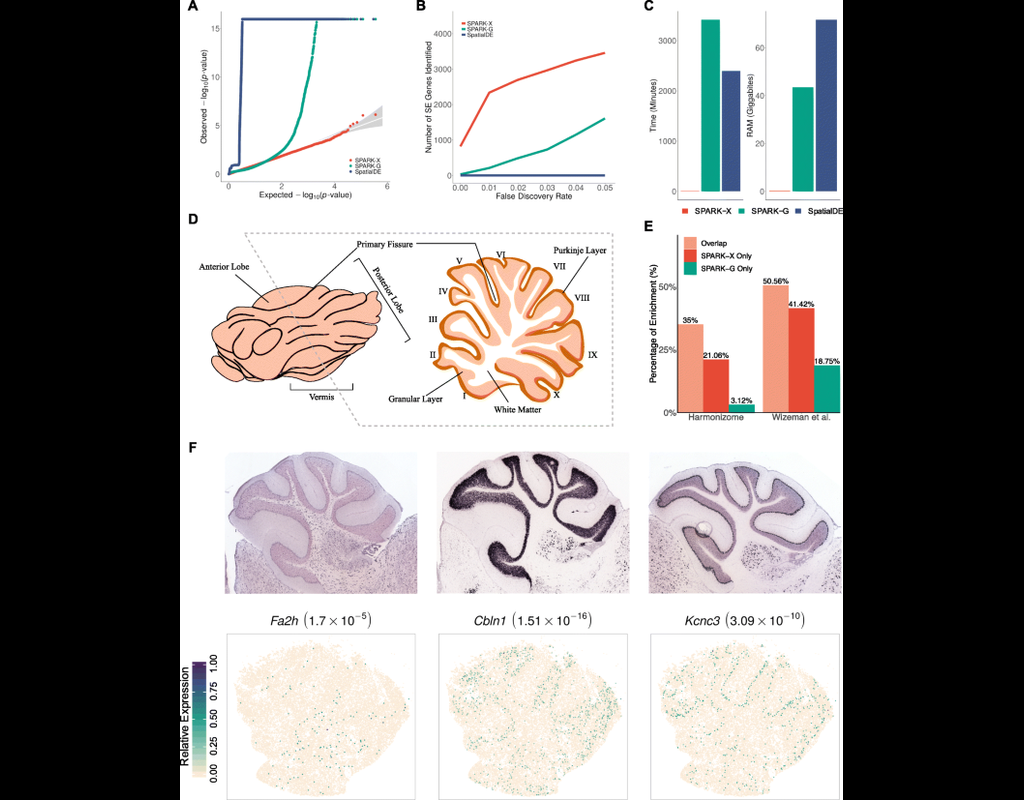
Spatial transcriptomic studies are becoming increasingly common and large, posing important statistical and computational challenges for many analytic tasks. Here, we present SPARK-X, a non-parametric method for rapid and effective detection of spatially expressed genes in large spatial transcriptomic studies.
SPARK-X not only produces effective type I error control and high power but also brings orders of magnitude computational savings. We apply SPARK-X to analyze three large datasets, one of which is only analyzable by SPARK-X. In these data, SPARK-X identifies many spatially expressed genes including those that are spatially expressed within the same cell type, revealing new biological insights.
Trends

BioTuring
Spatially resolved gene expression profiles are key to understand tissue organization and function. However, spatial transcriptomics (ST) profiling techniques lack single-cell resolution and require a combination with single-cell RNA sequencing (scRN(More)