


Notebooks

Categories


Cells
Premium


BioTuring
Single-cell RNA data allows cell-cell communications (***CCC***) methods to infer CCC at either the individual cell or cell cluster/cell type level, but physical distances between cells are not preserved Almet, Axel A., et al., (2021). On the other hand, spatial data provides spatial distances between cells, but single-cell or gene resolution is potentially lost. Therefore, integrating two types of data in a proper manner can complement their strengths and limitations, from that improve CCC analysis.
In this pipeline, we analyze CCC on Visium data with single-cell data as a reference. The pipeline includes 4 sub-notebooks as following
01-deconvolution: This step involves deconvolution and cell type annotation for Visium data, with cell type information obtained from a relevant single-cell dataset. The deconvolution method is SpatialDWLS which is integrated in Giotto package.
02-giotto: performs spatial based CCC and expression based CCC on Visium data using Giotto method.
03-nichenet: performs spatial based CCC and expression based CCC on Visium data using NicheNet method.
04-visualization: visualizes CCC results obtained from Giotto and NicheNet.

BioTuring
Build single-cell trajectories with the software that introduced **pseudotime**. Find out about cell fate decisions and the genes regulated as they're made.
Group and classify your cells based on gene expression. Identify new cell types and states and the genes that distinguish them.
Find genes that vary between cell types and states, over trajectories, or in response to perturbations using statistically robust, flexible differential analysis.
In development, disease, and throughout life, cells transition from one state to another. Monocle introduced the concept of **pseudotime**, which is a measure of how far a cell has moved through biological progress.
Many researchers are using single-cell RNA-Seq to discover new cell types. Monocle 3 can help you purify them or characterize them further by identifying key marker genes that you can use in follow-up experiments such as immunofluorescence or flow sorting.
**Single-cell trajectory analysis** shows how cells choose between one of several possible end states. The new reconstruction algorithms introduced in Monocle 3 can robustly reveal branching trajectories, along with the genes that cells use to navigate these decisions.
BioTuring
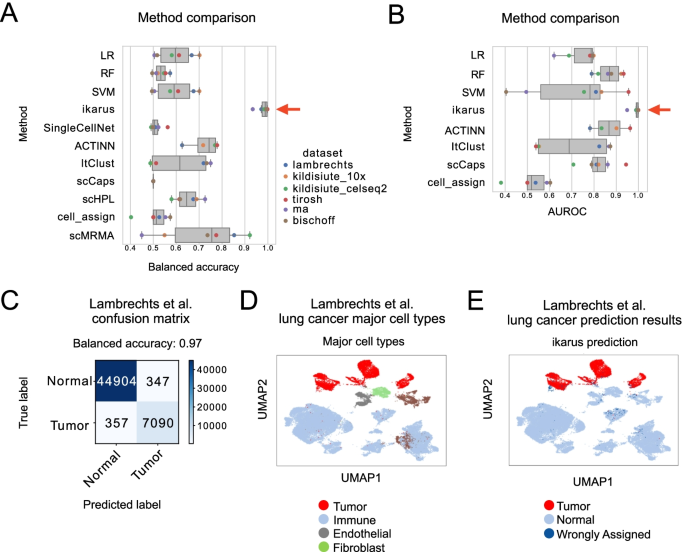
Tumors are complex tissues of cancerous cells surrounded by a heterogeneous cellular microenvironment with which they interact. Single-cell sequencing enables molecular characterization of single cells within the tumor. However, cell annotation—the assignment of cell type or cell state to each sequenced cell—is a challenge, especially identifying tumor cells within single-cell or spatial sequencing experiments.
Here, we propose ikarus, a machine learning pipeline aimed at distinguishing tumor cells from normal cells at the single-cell level. We test ikarus on multiple single-cell datasets, showing that it achieves high sensitivity and specificity in multiple experimental contexts.
**InferCNV** is a Bayesian method, which agglomerates the expression signal of genomically adjointed genes to ascertain whether there is a gain or loss of a certain larger genomic segment. We have used **inferCNV** to call copy number variations in all samples used in the manuscript.

BioTuring
CellRank2 (Weiler et al, 2023) is a powerful framework for studying cellular fate using single-cell RNA sequencing data. It can handle millions of cells and different data types efficiently. This tool can identify cell fate and probabilities across various data sets. It also allows for analyzing transitions over time and uncovering key genes in developmental processes. Additionally, CellRank2 estimates cell-specific transcription and degradation rates, aiding in understanding differentiation trajectories and regulatory mechanisms.
In this notebook, we will use a primary tumor sample of patient T71 from the dataset GSE137804 (Dong R. et al, 2020) as an example. We have performed RNA-velocity analysis and pseudotime calculation on this dataset in scVelo (Bergen et al, 2020) notebook. The output will be then loaded into this CellRank2 notebook for further analysis.
This notebook is based on the tutorial provided on CellRank2 documentation. We have modified the notebook and changed the input data to show how the tool works on BioTuring's platform.
Trends

BioTuring
Single-cell RNA sequencing (scRNA-seq) data have allowed us to investigate cellular heterogeneity and the kinetics of a biological process. Some studies need to understand how cells change state, and corresponding genes during the process, but it is (More)